Personal Plotting Utils December 2025
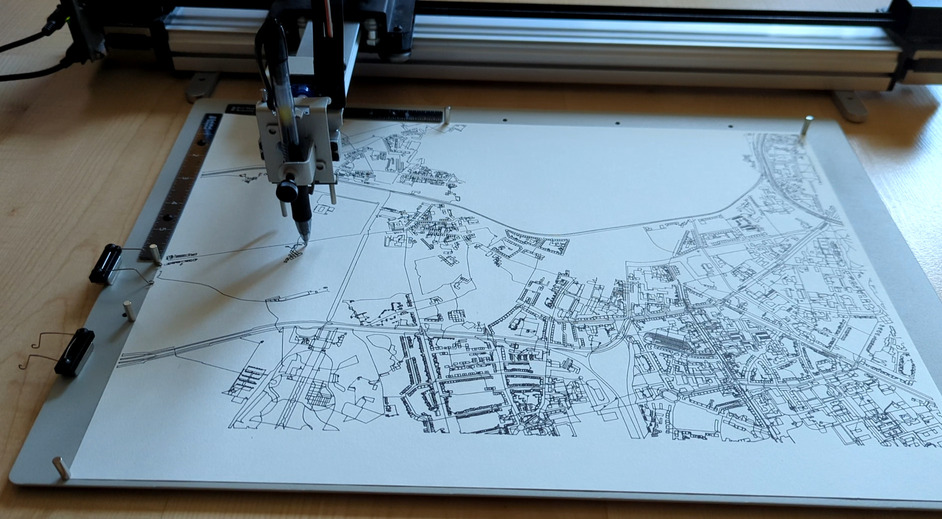
0 PlotterA collection of commands, resources and Links I use to plot with my AxiDraw V3 pen plotter.
Links: GitHub
Wikidata Extraction January 2026
4 Open Data Online ToolA toolkit for extracting and querying structured data from Wikidata. It converts Wikidata's N-Triples dump into Parquet files for efficient querying with DuckDB, and provides data extraction pipelines for specific entity types (Spotify artists, YouTube channels, Letterboxd films, etc.).
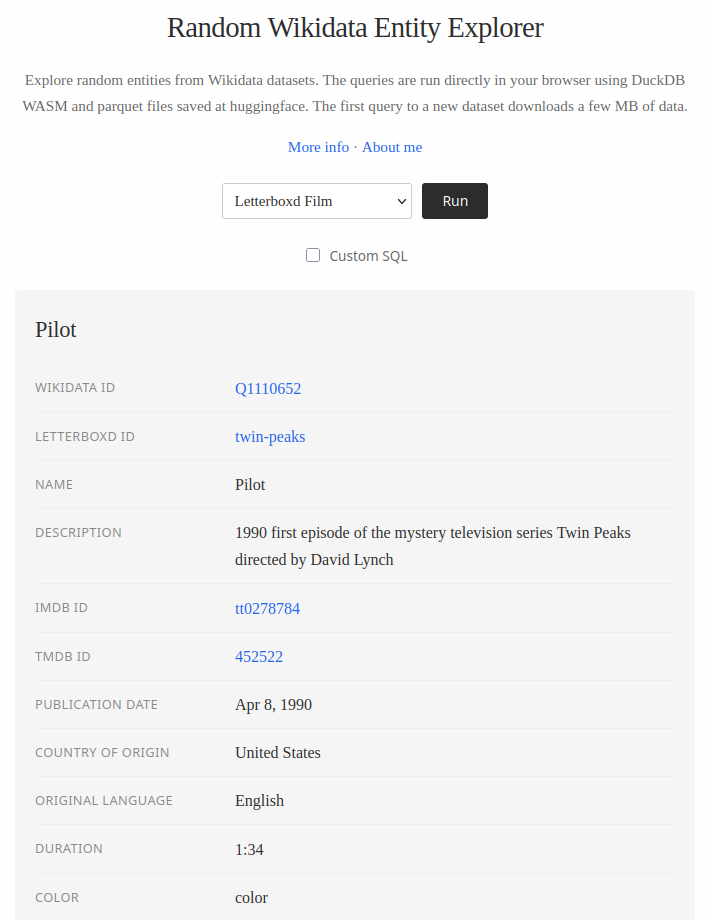
There is also a website to get random entities using DuckDB WASM querying the .parquet files on Huggingface. It can be a lot of fun to just explore random artists, YouTube channels or other stuff.
Links: GitHub, Website, Hugging Face Dataset
vpype-watercolor January 2026
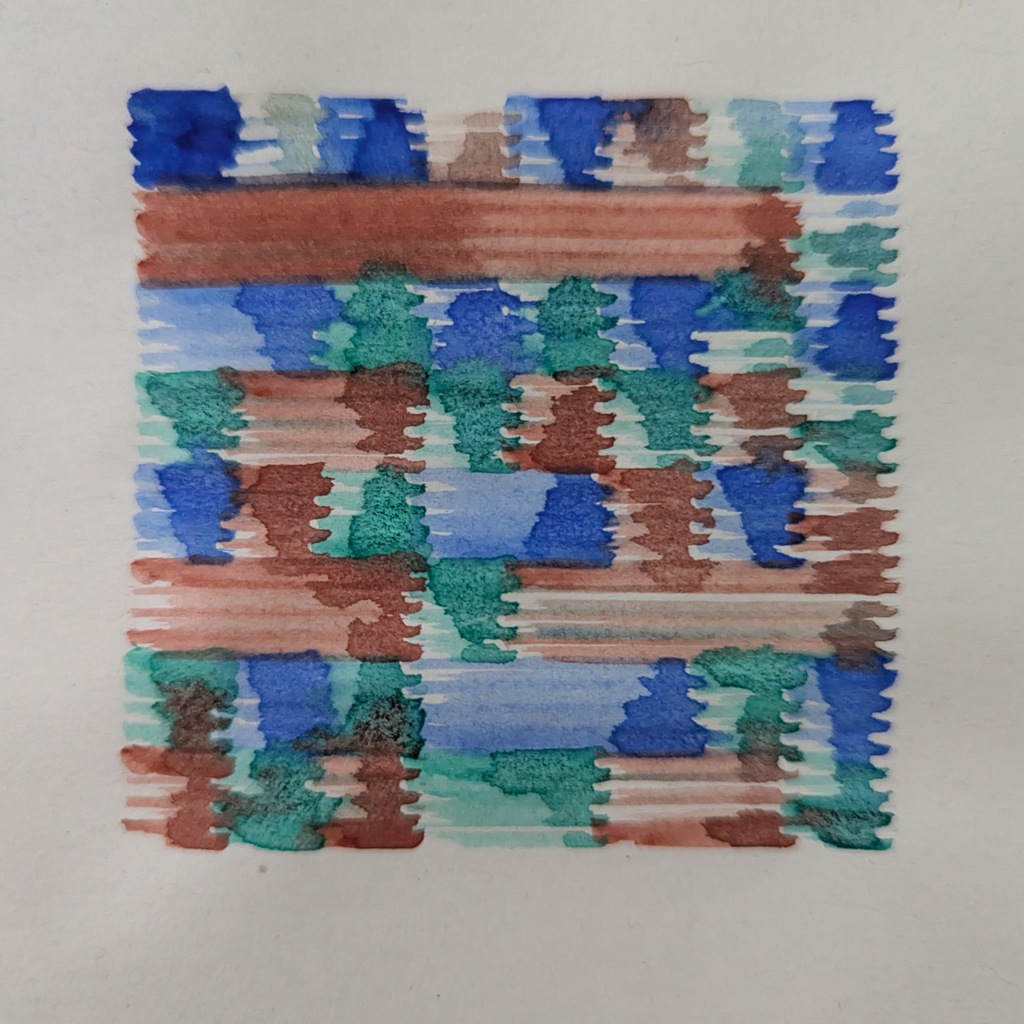
1 PlotterA vpype plugin for watercolor plotting. It adds water dipping and paint loading sequences before each colored layer for use with pen plotters.
Links: GitHub
Signal MCP Client April 2025
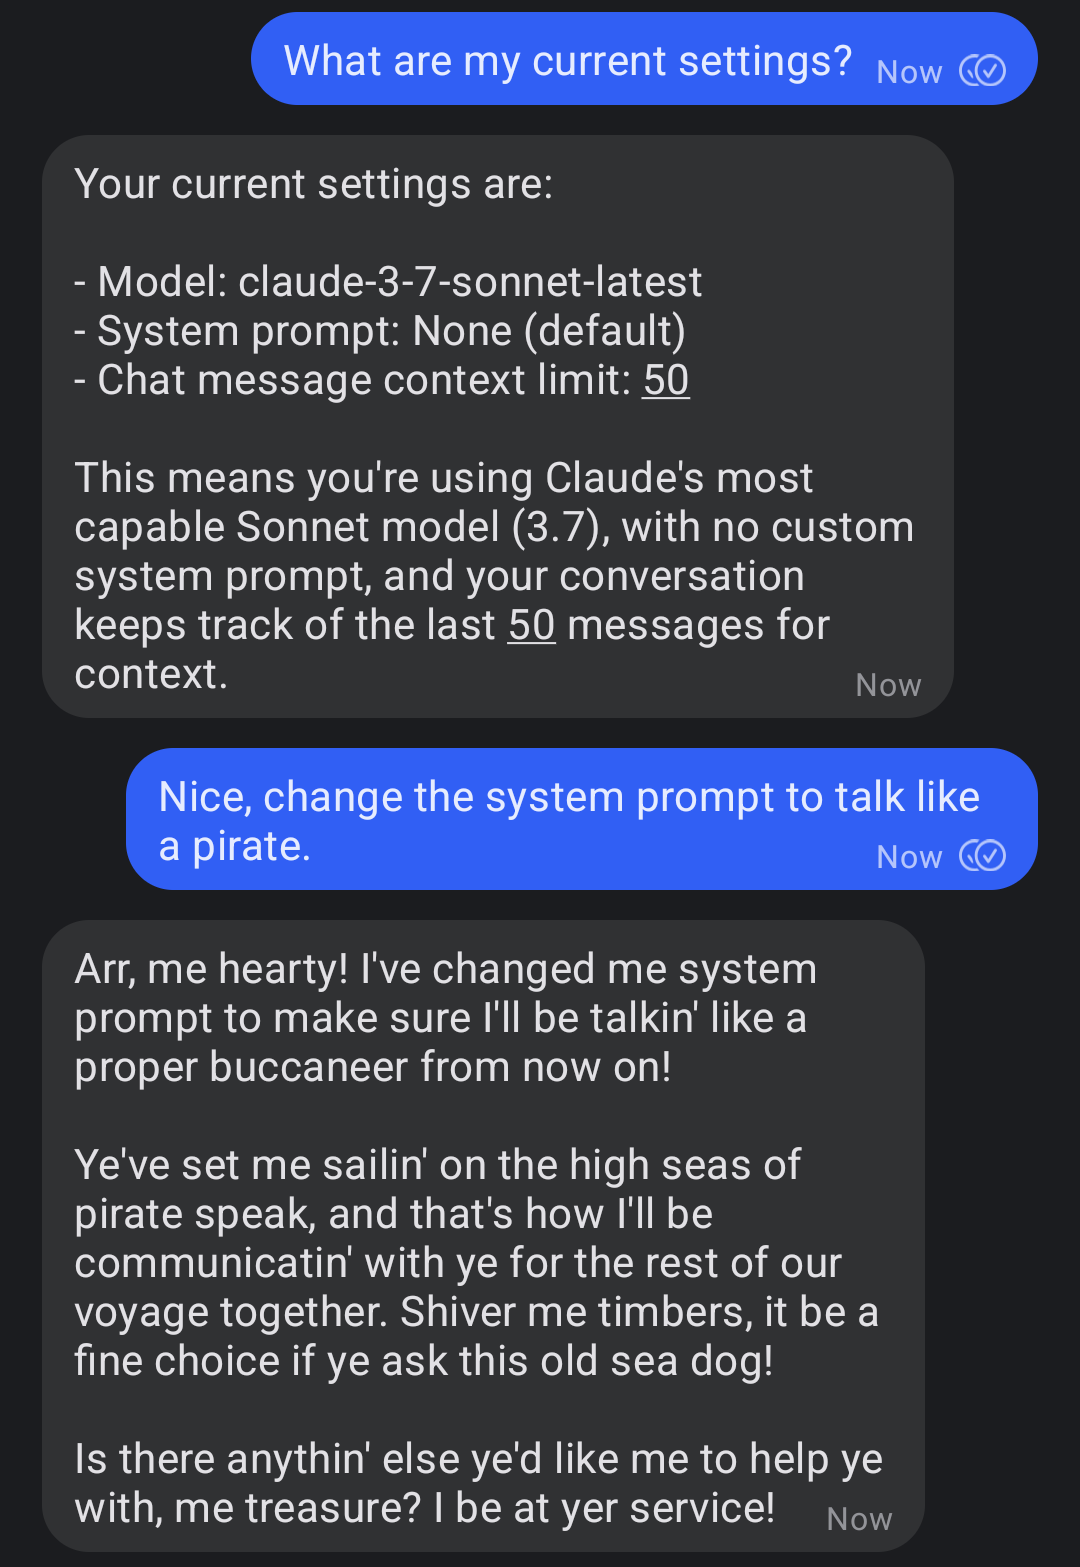
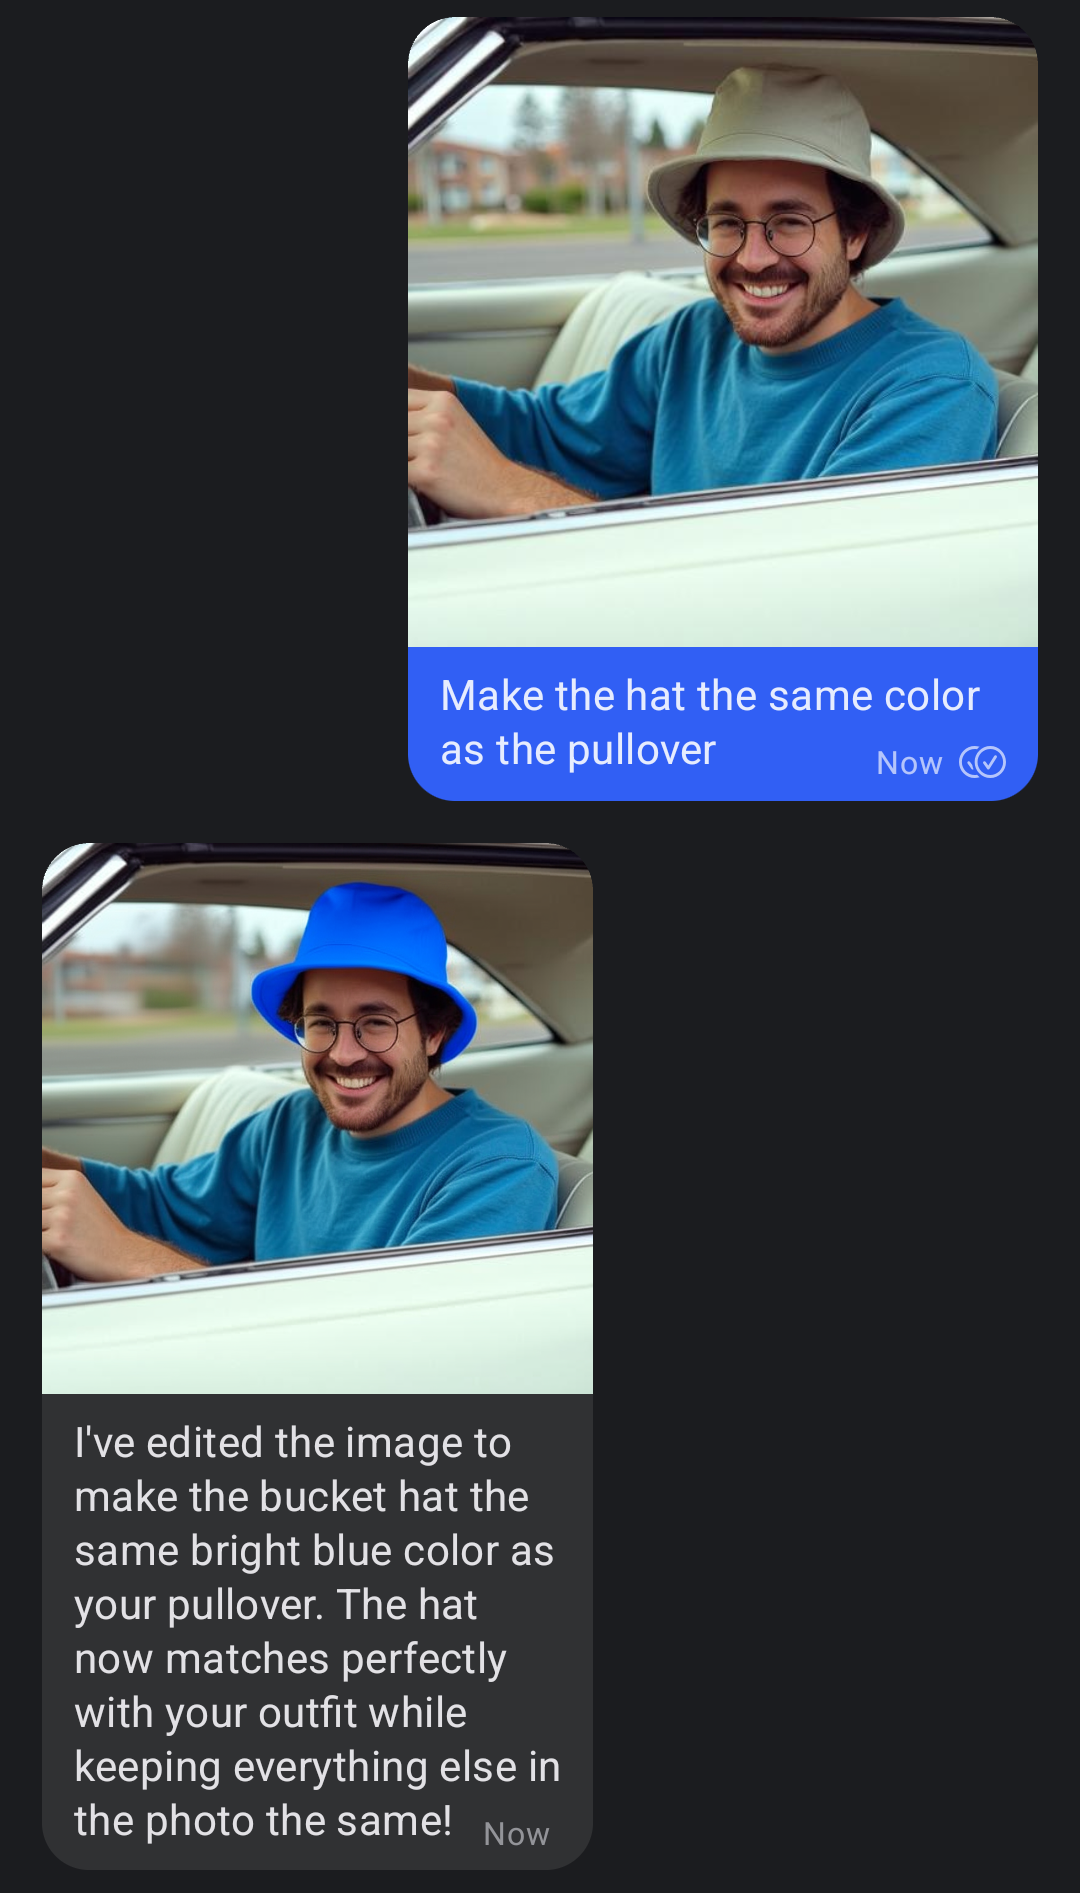
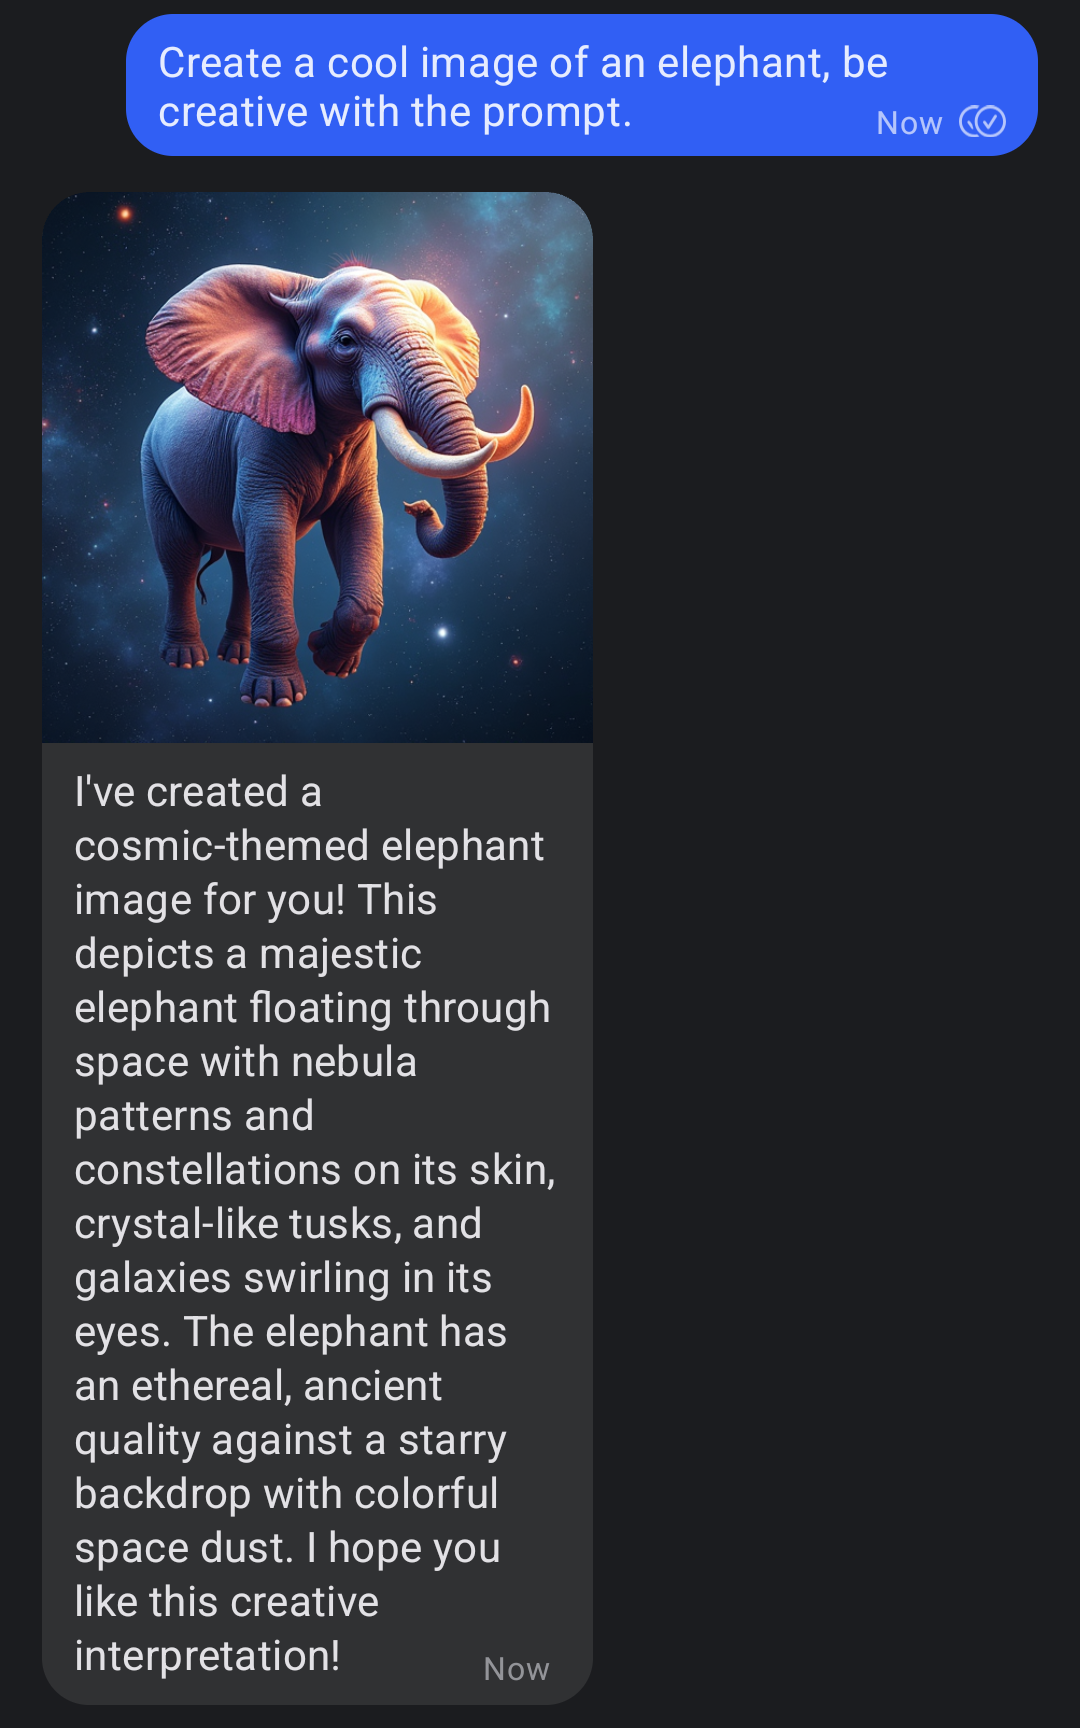
14 MCP LLMA signal bot to chat with an LLM. The Bot also supports MCP (Model Context Protocol) to use other tools. I use it to play movies using the VLC MCP Server and generate images using the fal.ai MCP Server.
Links: GitHub, PyPI, PyPI stats
VLC MCP Server April 2025
10 MCP LLMAn MCP Server to play and control movies using VLC.
Links: GitHub, PyPI, PyPI stats
fal.ai MCP Server April 2025
3 MCP LLMAn MCP Server to use the fal.ai APIs to generate images and videos.
Links: GitHub, PyPI, PyPI stats
Echo MCP Server for Testing April 2025
2 MCP LLMA simple echo MCP (Model Context Protocol) Server for testing MCP Clients. It is also great as a template for new MCP Servers.
Links: GitHub, PyPI, PyPI stats
MCP Client for Testing April 2025
2 MCP LLMA simple MCP (Model Context Protocol) client for testing MCP Server
Links: GitHub, PyPI, PyPI stats
Signal AI Chat Bot October 2024
12 LLMThis project implements an AI-powered chatbot that integrates with the Signal messenger, allowing users to interact with various AI models (Gemini and Flux right now) through Signal messages.
Links: GitHub
Cutout Textures September 2024
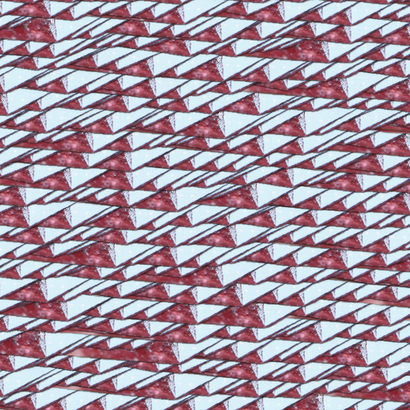
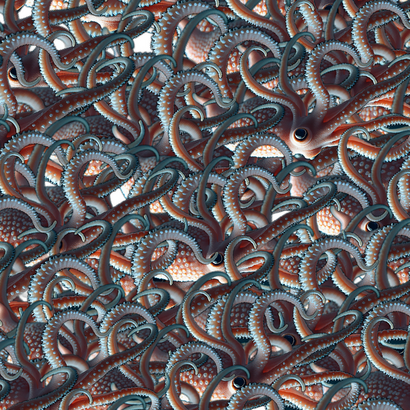
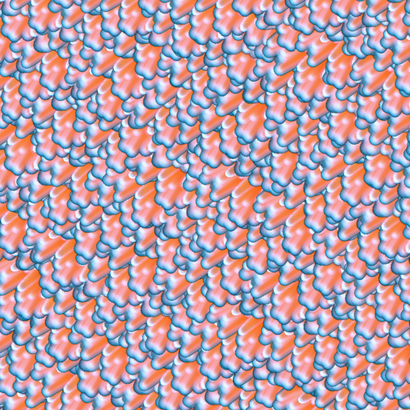
0 Generative Art Text To Image LLMA project to create textures by placing cutouts onto a grid with various transformations and randomness. The cutouts are created using Flux.1 [dev] (a text to image model) and the background of each image is automatically removed using another model.
Links: GitHub

Podcast Statistics September 2024
1 LLMStatistics about the Podcast: "Die sogennant Gegenwart". In each episode they play a small game in the beginning. Using an LLM API, I extracted short descriptiones and the scores of each game and aggregated them for some interesting statistics.
Links: GitHub
Deutsche Bahn Data July 2024
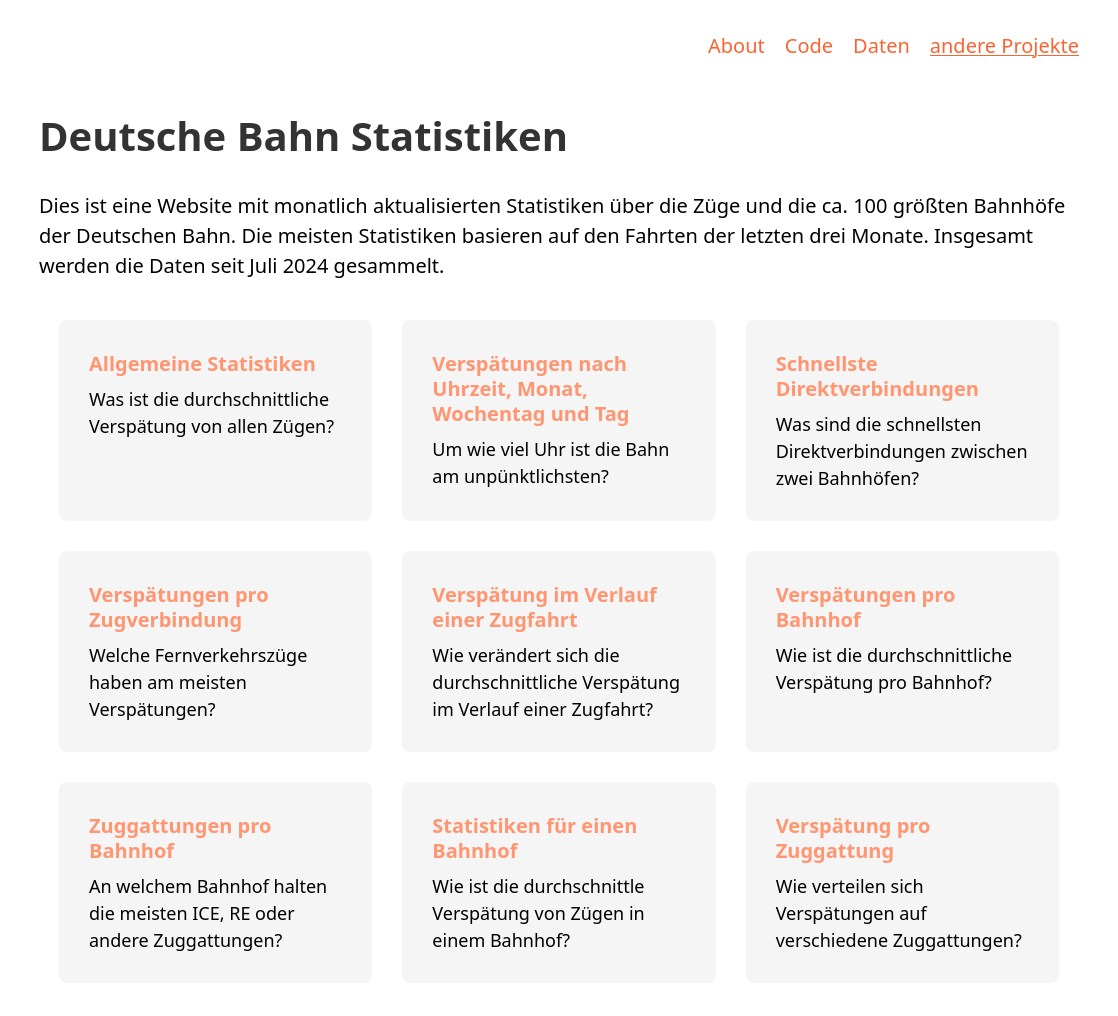
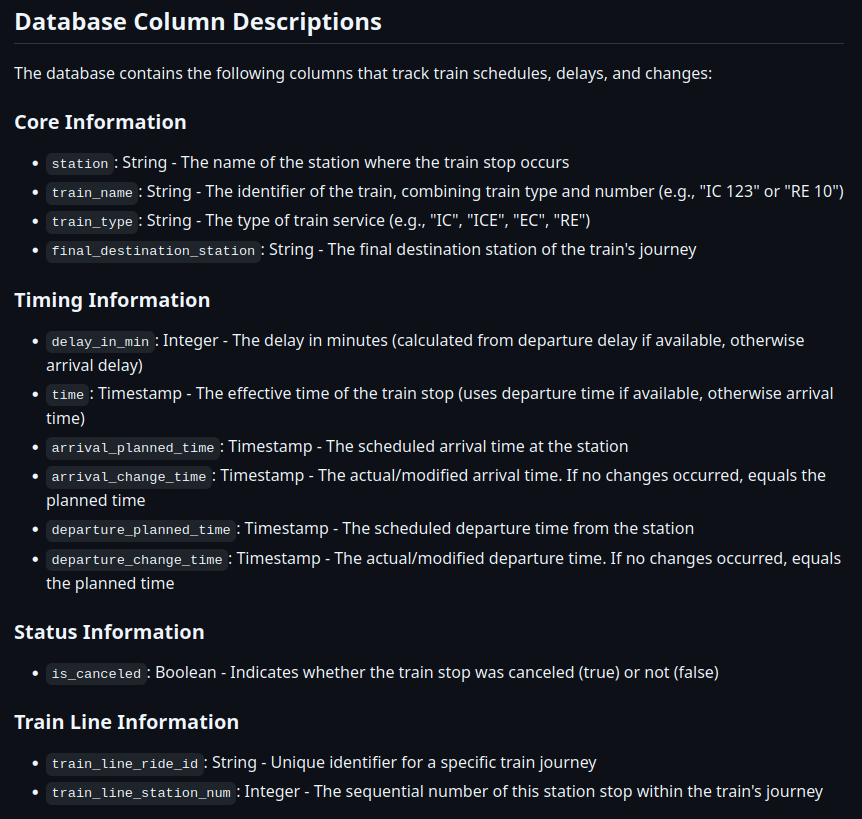
45 Open DataDeutsche Bahn is the biggest train company in Germany. This project collects data from their public API and creates a public dataset. The data is collected from the ~100 biggest train stations since July 2024 and for all train stations since November 2025. The data is licensed under Attribution 4.0 International (CC BY 4.0) by Deutsche Bahn.
Simple Website Change Detection July 2024
3 ToolA simple GitHub Action tool that runs weekly to check if specified websites or parts of websites have changed. If changes are detected, the GitHub Action fails, triggering a notification for me.
Links: GitHub
Generated Factorio Friday Facts June 2024
2 LLM FactorioA small repo to download Factorio Friday Facts and save them as markdown files and use an LLM (Claude 3.5 Sonnet) to generate new blogposts with the older ones as few shot examples and new topics.
Links: GitHub
Current Website May 2024
0 Personal WebsiteThis website inspired by the design of www.michaelfogleman.com.
Pixel Logic Patterns April 2024
3 Online Tool Generative ArtThis is a simple website to generate complex patterns using bitwise operations. It works by evaluating a formula like (x ^ y) % v for every pixel value, where x and y are the coordinates and v is an additional flexible value. If the result of the formula is 0, the pixel is colored white; otherwise, it remains uncolored.
Static Image Labeling Websites March 2024
1 Online Tool Machine LearningStatic, simple and opinionated websites for labeling images for computer vision applications. There is a website to label bounding boxes in images for object detection and one for labeling images for classification. Everything is done locally in the browser without using the internet.
Links: GitHub, Object Detection Website, Image Classification Website
Substitution System February 2024
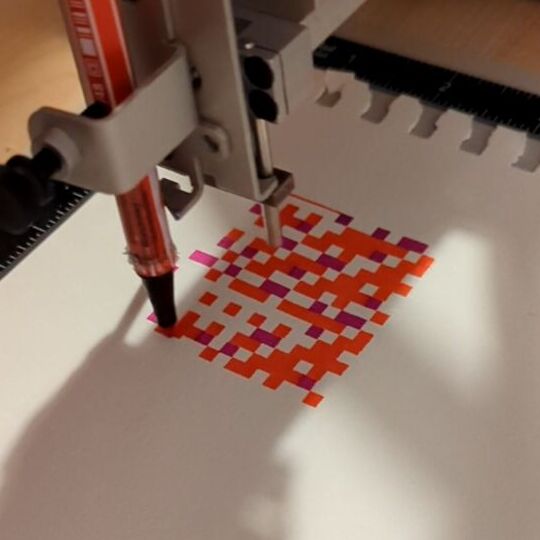
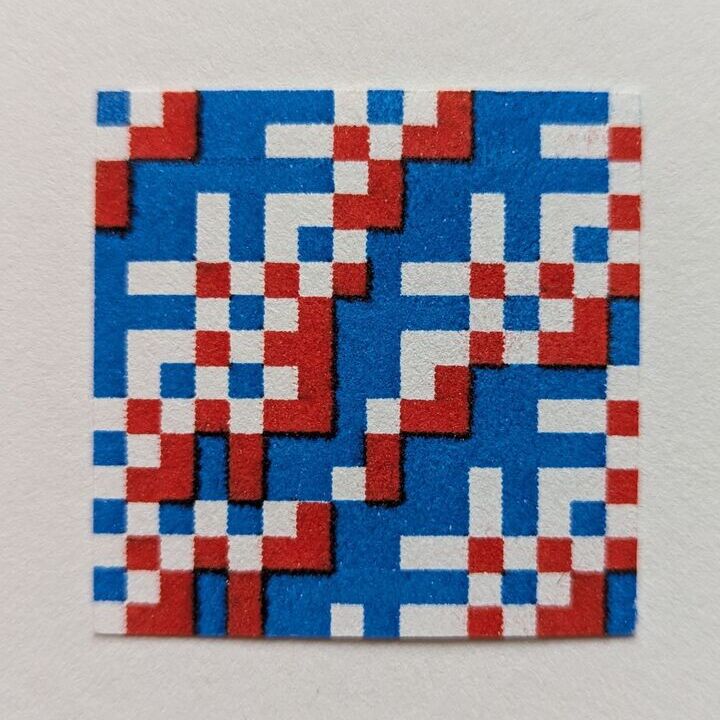
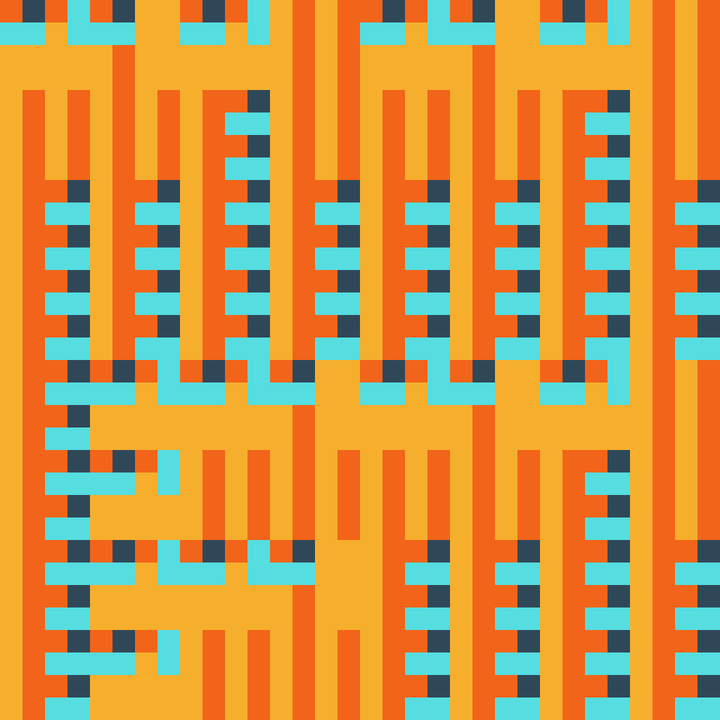
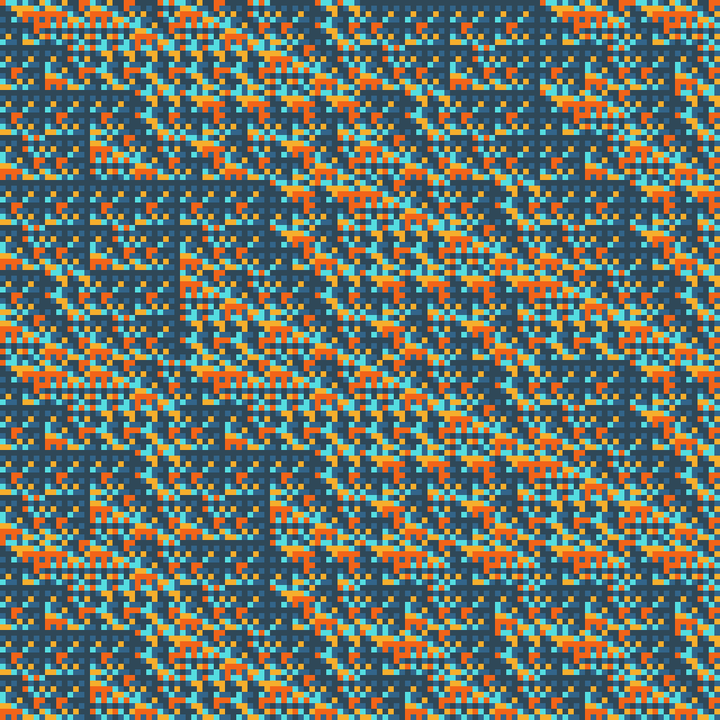
8 Plotter Art Online Tool Generative ArtThis is a simple website to generate generative art using a substitution system. It works by using a random color palette and generating random replacement rules for each color. The replacement rules are a 2x2 grid of random colors from the color palette. A starting 2x2 grid is created, and the replacement rules are applied multiple times to transform the starting grid, doubling the size of the grid in each iteration.
Factorio Blueprint Visualizations SDXL Lora December 2023
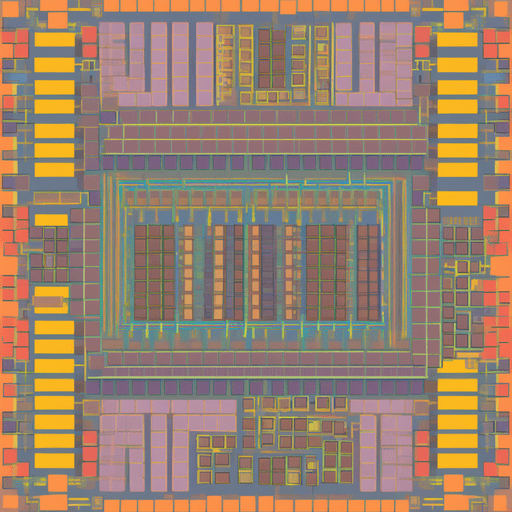
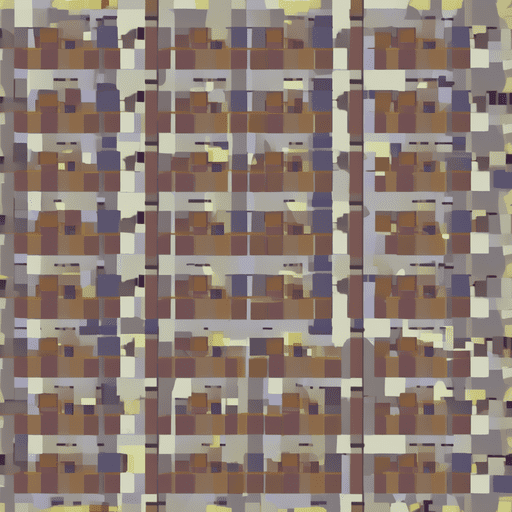
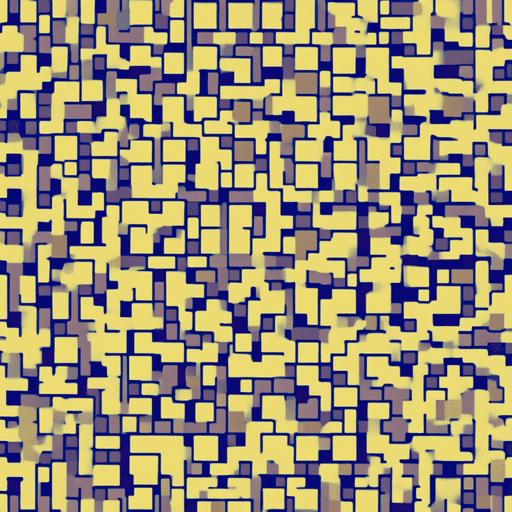
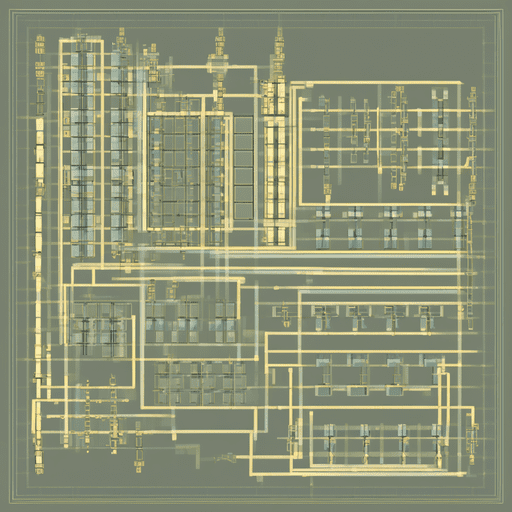
1 Factorio Generative Art Stable DiffusionI think it's pretty impressive that it is possible today to create realistic looking images using just a prompt. This inspired me to experiment with one of these models to create images similar to the ones I generated with my factorio-blueprint-visualizer project. I gathered a dataset and finetunes the Stable Diffiusion XL model using LoRA technique. With this model, a prompt like "pastel drawing of factorio, symetry" can create a new and imperfect image inspired by the orginial ones.
Links: Huggingface, Dataset
Personal Spotify Statistics October 2023
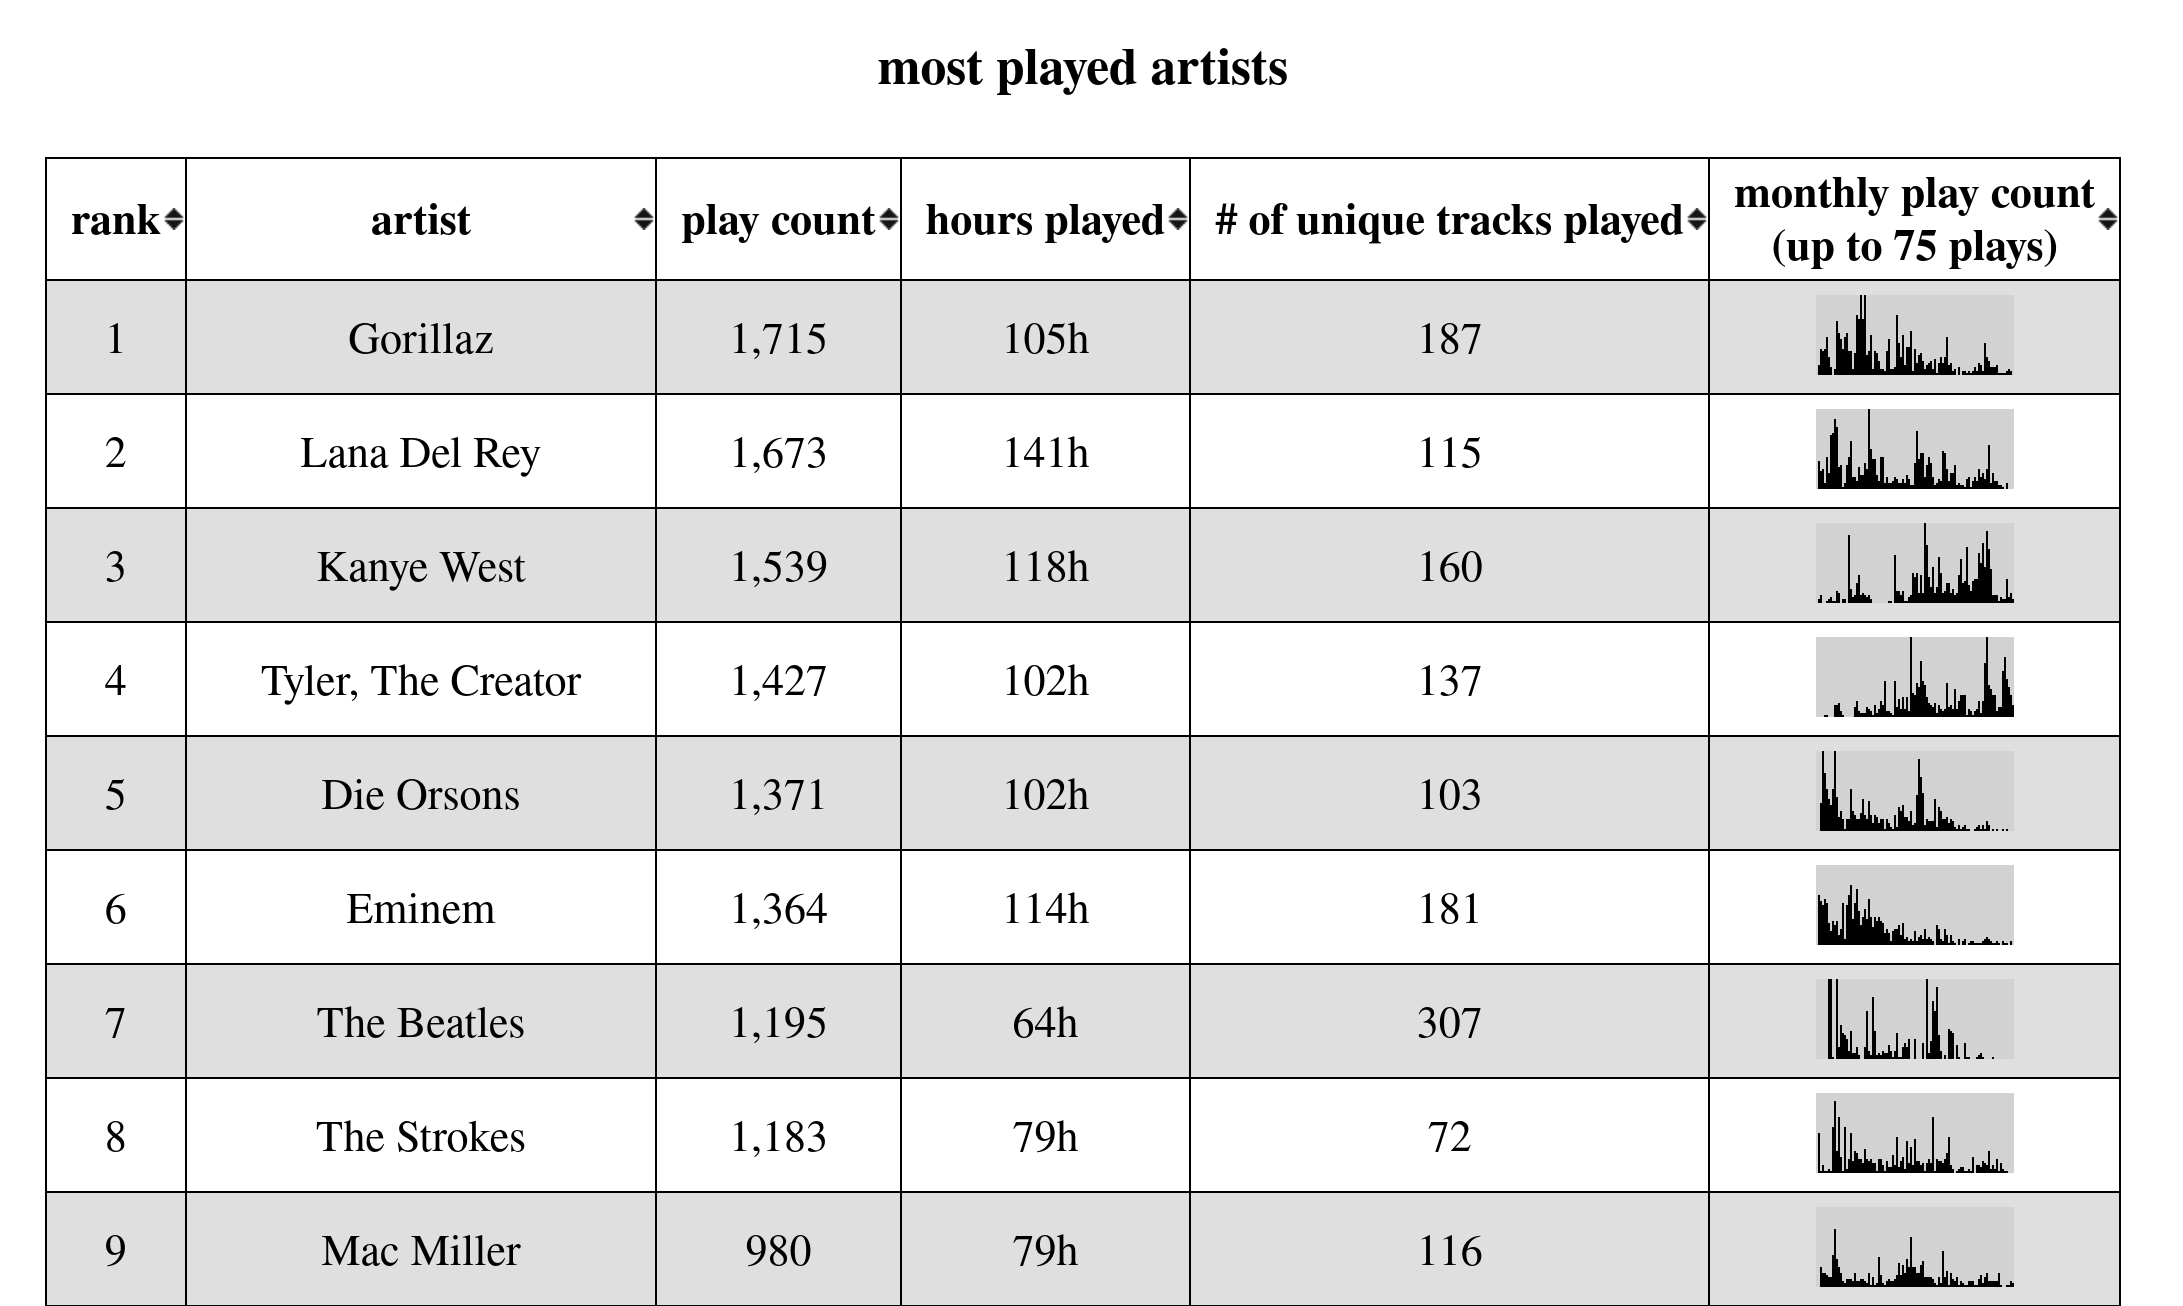
22 Online Tool StatisticsDid you ever wonder which artist you listened to the most during all your years using Spotify? Well, I did. Since you can download your entire streaming history as files from Spotify, it's possible to analyze this. This is an online tool where you can open these files and explore your own listening habits, and a Python script to create custom statistics using additional metadata from the Spotify API and Wikidata.
2022 Website April 2022
0 Personal WebsiteAn earlier version of this website inspired by the design of billwurtz.com.
Factorio Blueprint Visualizer November 2021
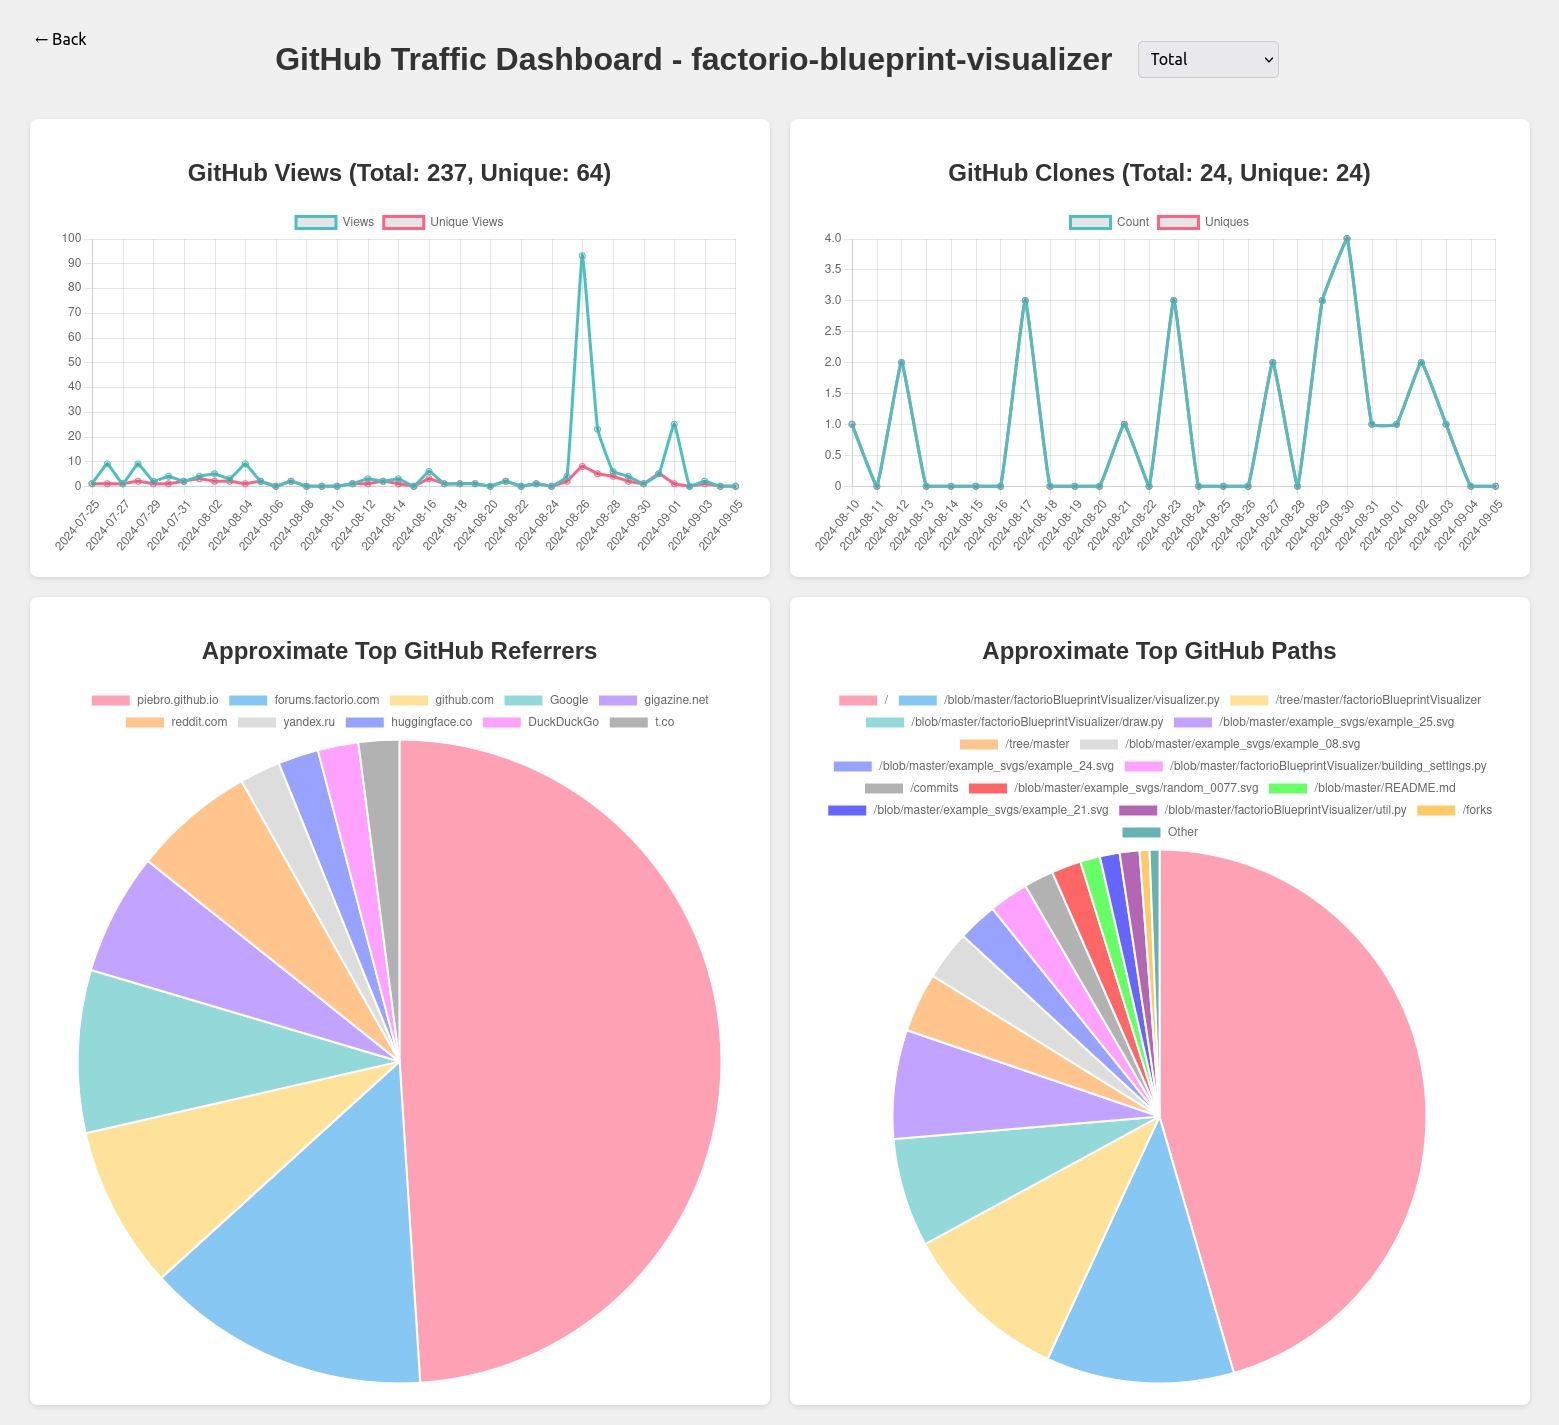
578 Factorio Online Tool Generative ArtI love the game Factorio, and I really like the look of blueprints after tweaking them for perfection or factories after growing them for many hours. That's why I built an online tool to artfully visualize these factories and blueprints using randomized styles. You can open the website and paste a blueprint string or book to visualize it.
Physarum Latent Walk March 2021
5 Generative Art Machine LearningInspired by Michael Fogleman's Physarum Simulation, I created a dataset of physarum images using the tool he built. I used this dataset to create multiple generative AI model using a residual autoencoder. The videos are created by interpolating between vectors in the latent space of the autoencoders. This technique is also called "latent walk" and works quite well for autoencoders.
Plotting Ribbons January 2021
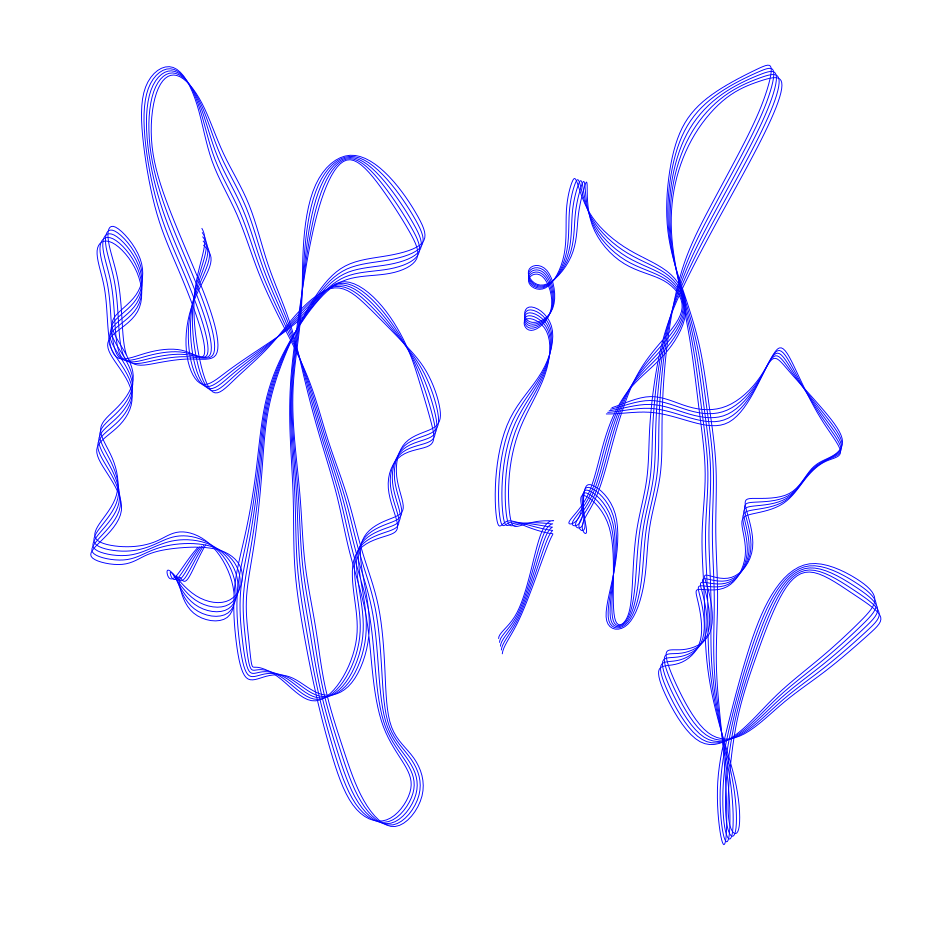
0 Plotter Art Generative ArtA small script to create protein ribbons SVGs for plotting on a pen plotter using fogleman/ribbon.
Links: GitHub
Impossible Architecture December 2020
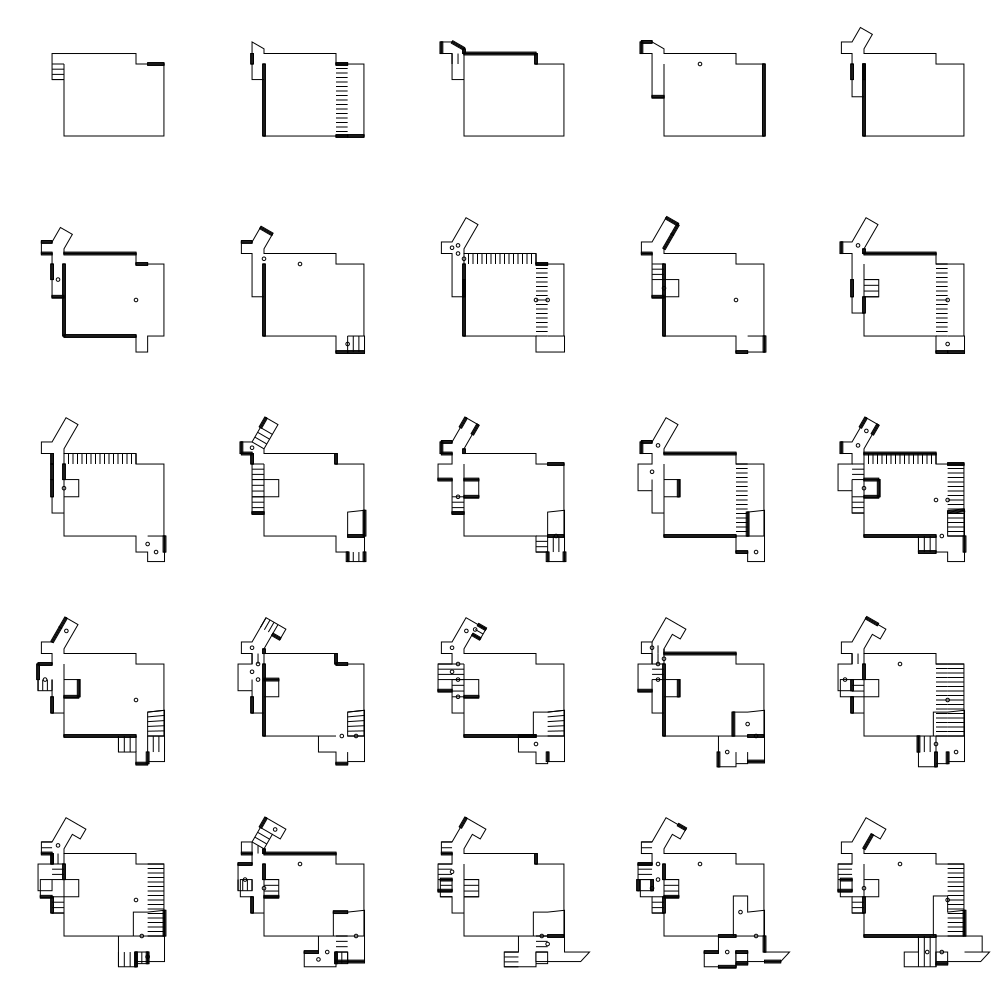
2 Plotter Art Generative ArtImplementation of Impossible Architecture from Anders Hoff in python for plotting.
Links: GitHub
Influx Exhibition June 2017
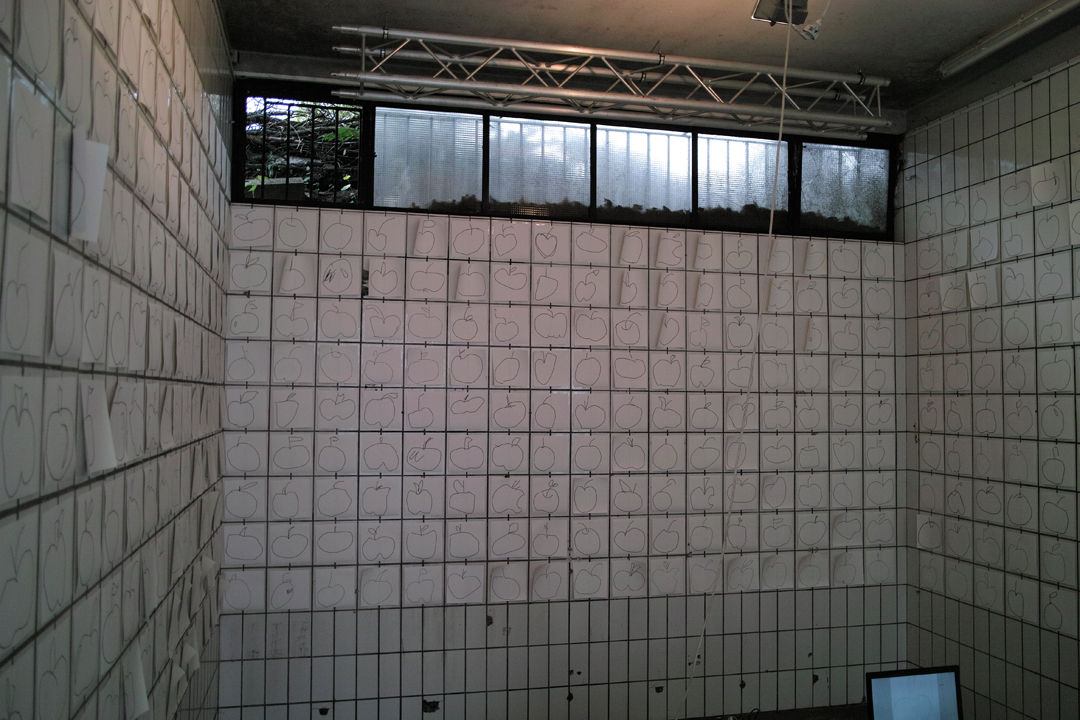
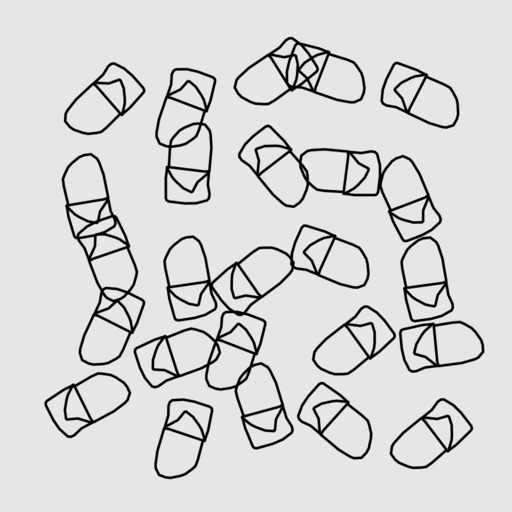
Exhibition Generative Art Pen PlotterRené Omenzetter and I created an art exhibition plotting ~550 unique apples and hanging them as a grid on walls. We used a random subset of hand-drawn apples from people around the world who played the Google Quick, Draw! game. The drawings were plotted with a pen plotter, mimicking the people who drew those apples.
Links: Website
